
-
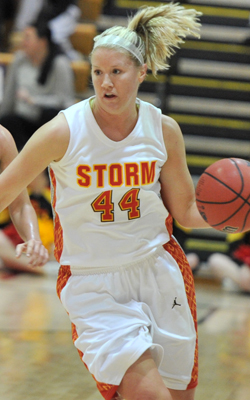
- Height:
- 5-11
-
- Year:
- Sr.
-
- Hometown:
- Urbandale, Iowa
-
- High School:
- Johnston
-
- Position:
- F
-
- gp
- 29
-
- pts/g
- 22.3
-
- fg %
- 53.7
-
- 3pt %
- 50.7
-
- ft %
- 80.0
-
- reb/g
- 8.8
-
- a/g
- 1.6
Bio
 Career Notes
• State Farm/WBCA Division III Player of the Year Finalist (2013)
• Capital One First Team Academic All-American (2013)
• WBCA Division III Coaches' All-American (2013)
• Jostens Trophy Finalist (2013)
• D3hoops.com West Region Player of the Year (2013)
• Iowa Conference Most Valuable Player (2013)
• 2-time first team all-conference (2011-12, 2012-13)
• 2-time first team academic all-district (2011-12, 2012-13)
• Academic all-conference (2011-12)
• 3-year letterwinner
• Transferred to Simpson for the 2010-11 season after spending a year at Minnesota State, Mankato.
2012-13 | senior
Named State Farm/WBCA Player of the Year finalist, D3hoops.com West Region Player of the Year, Jostens Trophy Finalist, Capital One First Team Academic All-American and Iowa Conference Most Valuable Player ... also a 2013 WBCA Division III Coaches' All-America Team selection and D3hoops.com First Team All-West Region performer ... named IIAC Player of the Week seven times during the season ... scored 648 points, second-highest single season total in school history, just nine shy of tying the record of 657 set by Carla Horstmann in 1976-77 ... set Simpson single-season records for rebounds (642), 3-point percentage (.507), and free throws made (176) ... closed career with 1,258 points and 642 rebounds, one of six players in school history with 1,000 points and 500 career rebounds ... one of only two with 1,000 points, 500 rebounds and more than 150 steals (184) ... second player in school history to tally 1,000 points in less than four seasons, doing so in three ... amassed 11 double-doubles during the season ... scored a career-high 35 points in a 62-60 loss to Amherst on 12/28, tied for the fifth-highest single game effort in school history and most by a Simpson player since Kerri Karsten scored 39 on 1/12/96 ... grabbed a career-high 19 rebounds at Buena Vista on 1/5, one shy of Stacey Schutjer's school record of 20 set on 3/4/11 ... went 6 of 9 from 3-point range in win over Loras on 2/22.
2011-12 | junior
Named first team all-conference ... earned first team academic all-district honors and and was an academic all-conference pick ... tied for team lead in scoring (13.6 ppg) and led team in rebounding (7.6 rpg) ... posted six double-doubles, including a 21-point, 14-rebound effort in a win against Thomas More on Dec. 30 ... scored a career-high 26 points in IIAC Tournament first round win over Wartburg on Feb. 23.
2010-11 | sophomore
Came off the bench in all 29 games ... averaged 7.9 points and 5.9 rebounds per game ... named to all-tornament team at Grand Canyon Classic ... reached double figures in scoring nine times ... grabbed 10 rebounds on two occasions (North Central, 11/20; Cornell, 1/5) ... scored a season-high 16 points and grabbed 9 rebounds against Buena Vista on 2/16.
2009-10 | freshman
A member of the soccer team at Minnesota State-Mankato.
Career Game-Highs
Points - 35 (vs. Amherst, 12/28/12)
Rebounds - 19 (vs. Buena Vista, 1/5/13)
Assists - 4 (5 times)
Steals - 6 (twice)
Blocks - 5 (at Coe, 1/4/12)
High School
A 2009 graduate of Johnson High School ... coached by Rich Gradoville ... chosen first team all-conference and third team all-state as a senior ... participated in the IGCA Gatorde All-Star Game ... earned second team honors as a junior ... an Elite First Team All-State performer in soccer ... also lettered in volleyball, helping Johnston to a state championship as a junior ... a member of the National Honor Society and the National Council on Youth Leadership.
Personal
Born May 16, 1991 ... daughter of Andy and Stacia Nielsen ... majoring in exercise science with a psychology minor ... has one brother, Troy.
| Career Statistics | ||||||||||||||||||
| Total | 3-point | F-throws | Rebounds | |||||||||||||||
| Year | gp-gs | fg-fga | pct | fg-fga | pct | ft-fta | pct | tot | avg | ast | to | blk | stl | pts | avg | |||
| 2010-11 | 29-0 | 82-184 | .446 | 1-6 | .167 | 63-85 | .741 | 172 | 5.9 | 25 | 44 | 13 | 36 | 228 | 7.9 | |||
| 2011-12 | 28-15 | 133-278 | .478 | 8-24 | .333 | 108-137 | .788 | 214 | 7.6 | 45 | 56 | 30 | 65 | 382 | 13.6 | |||
| 2012-13 | 29-29 | 218-406 | .537 | 36-71 | .507 | 176-220 | .800 | 256 | 8.8 | 47 | 75 | 32 | 83 | 648 | 22.3 | |||
| Total | 86-44 | 433-868 | .499 | 45-101 | .446 | 347-442 | .785 | 642 | 7.5 | 117 | 175 | 75 | 184 | 1258 | 14.6 | |||
* Career-highs and statistics updated through 2012-13 season
Player Profile
| Overall | Conf | |||
|---|---|---|---|---|
| Games | 29 | 14 | ||
| Games started | 29 | 14 | ||
| Minutes | 808 | 390 | ||
| Minutes per game | 27.9 | 27.9 | ||
| FG | 218-406 | 103-195 | ||
| FG Pct | 53.7 | 52.8 | ||
| 3PT | 36-71 | 19-36 | ||
| 3PT Pct | 50.7 | 52.8 | ||
| FT | 176-220 | 87-103 | ||
| FT Pct | 80.0 | 84.5 | ||
| Off rebounds | 69 | 36 | ||
| Def rebounds | 187 | 81 | ||
| Total rebounds | 256 | 117 | ||
| Rebounds per game | 8.8 | 8.4 | ||
| Personal fouls | 57 | 31 | ||
| Disqualifications | 1 | 1 | ||
| Assists | 47 | 23 | ||
| Turnovers | 75 | 40 | ||
| Assist to turnover ratio | 0.6 | 0.6 | ||
| Steals | 83 | 44 | ||
| Blocks | 32 | 19 | ||
| Points | 648 | 312 | ||
| Points per game | 22.3 | 22.3 | ||
| Points per 40 min | 32.1 | 32.0 | ||
Game Log - Shooting
| Date | Opponent | Score | gs | min | fg | pct | 3pt | pct | ft | pct | pts |
|---|---|---|---|---|---|---|---|---|---|---|---|
| Nov 16 | vs. Wis.-La Crosse | W, 71-60 | 1 | 33 | 10-19 | 52.6 | 0-0 | - | 8-15 | 53.3 | 28 |
| Nov 17 | at Wis.-Eau Claire | W, 70-52 | 1 | 21 | 9-9 | 100.0 | 0-0 | - | 1-2 | 50.0 | 19 |
| Nov 20 | AIB College of Business | W, 82-54 | 1 | 17 | 9-10 | 90.0 | 2-2 | 100.0 | 3-3 | 100.0 | 23 |
| Nov 23 | vs. Gust. Adolphus | W, 67-45 | 1 | 28 | 6-11 | 54.5 | 0-1 | 0.0 | 5-6 | 83.3 | 17 |
| Nov 24 | vs. Northland | W, 89-42 | 1 | 14 | 5-8 | 62.5 | 0-0 | - | 9-9 | 100.0 | 19 |
| Nov 28 | at Iowa Wesleyan | W, 72-53 | 1 | 28 | 9-16 | 56.3 | 2-3 | 66.7 | 3-6 | 50.0 | 23 |
| Dec 1 | Wheaton (Ill.) | W, 74-52 | 1 | 29 | 7-12 | 58.3 | 0-2 | 0.0 | 6-7 | 85.7 | 20 |
| Dec 5 | at Grand View | W, 67-50 | 1 | 31 | 3-10 | 30.0 | 0-0 | - | 7-8 | 87.5 | 13 |
| Dec 15 | Wis.-River Falls | W, 67-62 | - | - | - | - | - | - | - | - | - |
| Dec 28 | vs. Amherst | L, 62-60 | 1 | 33 | 12-21 | 57.1 | 2-3 | 66.7 | 9-10 | 90.0 | 35 |
| Dec 29 | vs. Kenyon | W, 60-58 | 1 | 33 | 6-17 | 35.3 | 0-2 | 0.0 | 5-10 | 50.0 | 17 |
| Jan 5 | at Buena Vista | W, 62-50 | 1 | 20 | 4-11 | 36.4 | 0-1 | 0.0 | 3-3 | 100.0 | 11 |
| Jan 9 | at Luther | W, 71-62 | 1 | 34 | 7-16 | 43.8 | 0-2 | 0.0 | 7-8 | 87.5 | 21 |
| Jan 12 | Wartburg | W, 66-57 | 1 | 33 | 6-14 | 42.9 | 2-4 | 50.0 | 8-9 | 88.9 | 22 |
| Jan 16 | Loras | W, 74-54 | 1 | 22 | 6-11 | 54.5 | 1-2 | 50.0 | 9-9 | 100.0 | 22 |
| Jan 19 | at Dubuque | W, 75-66 | 1 | 36 | 8-11 | 72.7 | 3-4 | 75.0 | 11-12 | 91.7 | 30 |
| Jan 21 | Coe | W, 58-56 | 1 | 29 | 6-15 | 40.0 | 1-4 | 25.0 | 3-4 | 75.0 | 16 |
| Jan 23 | Central (Iowa) | W, 73-56 | 1 | 24 | 6-10 | 60.0 | 3-3 | 100.0 | 11-12 | 91.7 | 26 |
| Jan 26 | at Coe | W, 70-62 | 1 | 28 | 11-20 | 55.0 | 1-3 | 33.3 | 5-5 | 100.0 | 28 |
| Jan 30 | Buena Vista | W, 76-42 | 1 | 16 | 6-10 | 60.0 | 1-2 | 50.0 | 0-1 | 0.0 | 13 |
| Feb 2 | Luther | W, 85-76 | 1 | 29 | 11-20 | 55.0 | 1-1 | 100.0 | 6-6 | 100.0 | 29 |
| Feb 6 | at Wartburg | W, 67-59 | 1 | 31 | 11-17 | 64.7 | 0-0 | - | 5-8 | 62.5 | 27 |
| Feb 9 | at Loras | W, 75-62 | 1 | 34 | 8-14 | 57.1 | 2-3 | 66.7 | 3-6 | 50.0 | 21 |
| Feb 13 | Dubuque | L, 72-56 | 1 | 29 | 5-12 | 41.7 | 1-2 | 50.0 | 5-6 | 83.3 | 16 |
| Feb 16 | at Central (Iowa) | W, 70-68 | 1 | 25 | 8-14 | 57.1 | 3-5 | 60.0 | 11-14 | 78.6 | 30 |
| Feb 22 | Loras | W, 76-68 | 1 | 36 | 9-19 | 47.4 | 6-9 | 66.7 | 4-5 | 80.0 | 28 |
| Feb 24 | Dubuque | W, 79-68 | 1 | 33 | 3-10 | 30.0 | 1-2 | 50.0 | 9-13 | 69.2 | 16 |
| Mar 1 | Westminster (Mo.) | W, 91-58 | 1 | 21 | 10-14 | 71.4 | 2-3 | 66.7 | 6-8 | 75.0 | 28 |
| Mar 2 | Wis.-Stevens Point | W, 88-84 | 1 | 26 | 6-13 | 46.2 | 2-4 | 50.0 | 8-8 | 100.0 | 22 |
| Mar 8 | at Wis.-Whitewater | L, 76-63 | 1 | 35 | 11-22 | 50.0 | 0-4 | 0.0 | 6-7 | 85.7 | 28 |
Game Log - Ball control
| Date | Opponent | Score | gs | min | off | def | reb | ast | to | a/to | stl | blk | pf | dq |
|---|---|---|---|---|---|---|---|---|---|---|---|---|---|---|
| Nov 16 | vs. Wis.-La Crosse | W, 71-60 | 1 | 33 | 4 | 6 | 10 | 1 | 0 | - | 2 | 1 | 2 | 0 |
| Nov 17 | at Wis.-Eau Claire | W, 70-52 | 1 | 21 | 0 | 2 | 2 | 1 | 5 | 0.2 | 3 | 0 | 4 | 0 |
| Nov 20 | AIB College of Business | W, 82-54 | 1 | 17 | 1 | 5 | 6 | 0 | 1 | 0.0 | 3 | 1 | 1 | 0 |
| Nov 23 | vs. Gust. Adolphus | W, 67-45 | 1 | 28 | 2 | 7 | 9 | 4 | 1 | 4.0 | 1 | 0 | 1 | 0 |
| Nov 24 | vs. Northland | W, 89-42 | 1 | 14 | 4 | 2 | 6 | 1 | 0 | - | 3 | 0 | 2 | 0 |
| Nov 28 | at Iowa Wesleyan | W, 72-53 | 1 | 28 | 2 | 5 | 7 | 4 | 2 | 2.0 | 2 | 0 | 1 | 0 |
| Dec 1 | Wheaton (Ill.) | W, 74-52 | 1 | 29 | 2 | 12 | 14 | 0 | 4 | 0.0 | 4 | 1 | 1 | 0 |
| Dec 5 | at Grand View | W, 67-50 | 1 | 31 | 2 | 3 | 5 | 3 | 4 | 0.8 | 4 | 1 | 1 | 0 |
| Dec 15 | Wis.-River Falls | W, 67-62 | - | - | - | - | - | - | - | - | - | - | - | - |
| Dec 28 | vs. Amherst | L, 62-60 | 1 | 33 | 3 | 12 | 15 | 1 | 5 | 0.2 | 5 | 1 | 1 | 0 |
| Dec 29 | vs. Kenyon | W, 60-58 | 1 | 33 | 6 | 10 | 16 | 1 | 3 | 0.3 | 2 | 1 | 3 | 0 |
| Jan 5 | at Buena Vista | W, 62-50 | 1 | 20 | 6 | 13 | 19 | 2 | 5 | 0.4 | 2 | 0 | 5 | 1 |
| Jan 9 | at Luther | W, 71-62 | 1 | 34 | 3 | 9 | 12 | 1 | 3 | 0.3 | 6 | 4 | 0 | 0 |
| Jan 12 | Wartburg | W, 66-57 | 1 | 33 | 2 | 7 | 9 | 1 | 3 | 0.3 | 3 | 0 | 1 | 0 |
| Jan 16 | Loras | W, 74-54 | 1 | 22 | 1 | 9 | 10 | 1 | 4 | 0.3 | 3 | 1 | 1 | 0 |
| Jan 19 | at Dubuque | W, 75-66 | 1 | 36 | 0 | 5 | 5 | 2 | 2 | 1.0 | 1 | 2 | 3 | 0 |
| Jan 21 | Coe | W, 58-56 | 1 | 29 | 4 | 6 | 10 | 4 | 2 | 2.0 | 6 | 1 | 2 | 0 |
| Jan 23 | Central (Iowa) | W, 73-56 | 1 | 24 | 3 | 5 | 8 | 2 | 2 | 1.0 | 5 | 1 | 2 | 0 |
| Jan 26 | at Coe | W, 70-62 | 1 | 28 | 2 | 5 | 7 | 3 | 2 | 1.5 | 1 | 0 | 4 | 0 |
| Jan 30 | Buena Vista | W, 76-42 | 1 | 16 | 5 | 5 | 10 | 4 | 1 | 4.0 | 2 | 0 | 1 | 0 |
| Feb 2 | Luther | W, 85-76 | 1 | 29 | 4 | 3 | 7 | 0 | 1 | 0.0 | 2 | 4 | 1 | 0 |
| Feb 6 | at Wartburg | W, 67-59 | 1 | 31 | 3 | 4 | 7 | 1 | 2 | 0.5 | 3 | 1 | 2 | 0 |
| Feb 9 | at Loras | W, 75-62 | 1 | 34 | 1 | 4 | 5 | 0 | 4 | 0.0 | 3 | 0 | 4 | 0 |
| Feb 13 | Dubuque | L, 72-56 | 1 | 29 | 1 | 5 | 6 | 0 | 4 | 0.0 | 2 | 3 | 1 | 0 |
| Feb 16 | at Central (Iowa) | W, 70-68 | 1 | 25 | 1 | 1 | 2 | 2 | 5 | 0.4 | 5 | 2 | 4 | 0 |
| Feb 22 | Loras | W, 76-68 | 1 | 36 | 1 | 12 | 13 | 3 | 2 | 1.5 | 6 | 3 | 1 | 0 |
| Feb 24 | Dubuque | W, 79-68 | 1 | 33 | 1 | 6 | 7 | 2 | 0 | - | 1 | 0 | 1 | 0 |
| Mar 1 | Westminster (Mo.) | W, 91-58 | 1 | 21 | 2 | 5 | 7 | 1 | 1 | 1.0 | 1 | 0 | 1 | 0 |
| Mar 2 | Wis.-Stevens Point | W, 88-84 | 1 | 26 | 1 | 7 | 8 | 2 | 3 | 0.7 | 2 | 2 | 3 | 0 |
| Mar 8 | at Wis.-Whitewater | L, 76-63 | 1 | 35 | 2 | 12 | 14 | 0 | 4 | 0.0 | 0 | 2 | 3 | 0 |
Career Stats - Shooting per game
| gp | gs | min/g | fg/g | pct | 3pt/g | pct | ft/g | pct | ppg | |
|---|---|---|---|---|---|---|---|---|---|---|
| 2012-13 | 29 | 29 | 27.9 | 7.5-14.0 | 53.7 | 1.2-2.4 | 50.7 | 6.1-7.6 | 80.0 | 22.3 |
| Total | 29 | 29 | 27.9 | 7.5-14.0 | 53.7 | 1.2-2.4 | 50.7 | 6.1-7.6 | 80.0 | 22.3 |
Career Stats - Shooting totals
| gp | gs | min | fg | pct | 3pt | pct | ft | pct | pts | |
|---|---|---|---|---|---|---|---|---|---|---|
| 2012-13 | 29 | 29 | 808 | 218-406 | 53.7 | 36-71 | 50.7 | 176-220 | 80.0 | 648 |
| Total | 29 | 29 | 808 | 218-406 | 53.7 | 36-71 | 50.7 | 176-220 | 80.0 | 648 |
Career Stats - Shooting per 40 min
| gp | gs | min/g | fg/40 | pct | 3pt/40 | pct | ft/40 | pct | pts/40 | |
|---|---|---|---|---|---|---|---|---|---|---|
| 2012-13 | 29 | 29 | 27.9 | 10.8-20.1 | 53.7 | 1.8-3.5 | 50.7 | 8.7-10.9 | 80.0 | 32.1 |
| Total | 29 | 29 | 27.9 | 10.8-20.1 | 53.7 | 1.8-3.5 | 50.7 | 8.7-10.9 | 80.0 | 32.1 |
Career Stats - Ball control per game
| gp | gs | mpg | off/g | def/g | reb/g | pf/g | dq/g | ast/g | to/g | a/to | stl/g | blk/g | |
|---|---|---|---|---|---|---|---|---|---|---|---|---|---|
| 2012-13 | 29 | 29 | 27.9 | 2.4 | 6.4 | 8.8 | 2.0 | 0.0 | 1.6 | 2.6 | 0.6 | 2.9 | 1.1 |
| Total | 29 | 29 | 27.9 | 2.4 | 6.4 | 8.8 | 2.0 | 0.0 | 1.6 | 2.6 | 0.6 | 2.9 | 1.1 |
Career Stats - Ball control totals
| gp | gs | min | off | def | reb | pf | dq | ast | to | a/to | stl | blk | |
|---|---|---|---|---|---|---|---|---|---|---|---|---|---|
| 2012-13 | 29 | 29 | 808 | 69 | 187 | 256 | 57 | 1 | 47 | 75 | 0.6 | 83 | 32 |
| Total | 29 | 29 | 808 | 69 | 187 | 256 | 57 | 1 | 47 | 75 | 0.6 | 83 | 32 |
Career Stats - Ball control per 40 min
| gp | gs | mpg | off/40 | def/40 | reb/40 | pf/40 | dq/40 | ast/40 | to/40 | a/to | stl/40 | blk/40 | |
|---|---|---|---|---|---|---|---|---|---|---|---|---|---|
| 2012-13 | 29 | 29 | 27.9 | 3.4 | 9.3 | 12.7 | 2.8 | 0.0 | 2.3 | 3.7 | 0.6 | 4.1 | 1.6 |
| Total | 29 | 29 | 27.9 | 3.4 | 9.3 | 12.7 | 2.8 | 0.0 | 2.3 | 3.7 | 0.6 | 4.1 | 1.6 |
Splits Stats - Shooting per game
| gp | gs | min/g | fg/g | pct | 3pt/g | pct | ft/g | pct | ppg | ||
|---|---|---|---|---|---|---|---|---|---|---|---|
| Event | Total | 29 | 29 | 27.9 | 7.5-14.0 | 53.7 | 1.2-2.4 | 50.7 | 6.1-7.6 | 80.0 | 22.3 |
| Conference | 14 | 14 | 27.9 | 7.4-13.9 | 52.8 | 1.4-2.6 | 52.8 | 6.2-7.4 | 84.5 | 22.3 | |
| Exhibition | - | - | - | 0.0-0.0 | - | 0.0-0.0 | - | 0.0-0.0 | - | - | |
| Location | Home | 13 | 13 | 26.5 | 6.9-13.1 | 52.9 | 1.8-3.1 | 57.5 | 6.0-7.0 | 85.7 | 21.6 |
| Away | 11 | 11 | 29.4 | 8.1-14.5 | 55.6 | 1.0-2.3 | 44.0 | 5.6-7.2 | 78.5 | 22.8 | |
| Neutral | 5 | 5 | 28.2 | 7.8-15.2 | 51.3 | 0.4-1.2 | 33.3 | 7.2-10.0 | 72.0 | 23.2 | |
| Result | Wins | 26 | 26 | 27.3 | 7.3-13.5 | 54.1 | 1.3-2.4 | 53.2 | 6.0-7.6 | 79.2 | 21.9 |
| Losses | 3 | 3 | 32.3 | 9.3-18.3 | 50.9 | 1.0-3.0 | 33.3 | 6.7-7.7 | 87.0 | 26.3 | |
| Month | November | 6 | 6 | 23.5 | 8.0-12.2 | 65.8 | 0.7-1.0 | 66.7 | 4.8-6.8 | 70.7 | 21.5 |
| December | 4 | 4 | 31.5 | 7.0-15.0 | 46.7 | 0.5-1.8 | 28.6 | 6.8-8.8 | 77.1 | 21.3 | |
| January | 9 | 9 | 26.9 | 6.7-13.1 | 50.8 | 1.3-2.8 | 48.0 | 6.3-7.0 | 90.5 | 21.0 | |
| February | 7 | 7 | 31.0 | 7.9-15.1 | 51.9 | 2.0-3.1 | 63.6 | 6.1-8.3 | 74.1 | 23.9 | |
| March | 3 | 3 | 27.3 | 9.0-16.3 | 55.1 | 1.3-3.7 | 36.4 | 6.7-7.7 | 87.0 | 26.0 |
Splits Stats - Shooting totals
| gp | gs | min | fg | pct | 3pt | pct | ft | pct | pts | ||
|---|---|---|---|---|---|---|---|---|---|---|---|
| Event | Total | 29 | 29 | 808 | 218-406 | 53.7 | 36-71 | 50.7 | 176-220 | 80.0 | 648 |
| Conference | 14 | 14 | 390 | 103-195 | 52.8 | 19-36 | 52.8 | 87-103 | 84.5 | 312 | |
| Exhibition | - | - | - | 0-0 | - | 0-0 | - | 0-0 | - | 0 | |
| Location | Home | 13 | 13 | 344 | 90-170 | 52.9 | 23-40 | 57.5 | 78-91 | 85.7 | 281 |
| Away | 11 | 11 | 323 | 89-160 | 55.6 | 11-25 | 44.0 | 62-79 | 78.5 | 251 | |
| Neutral | 5 | 5 | 141 | 39-76 | 51.3 | 2-6 | 33.3 | 36-50 | 72.0 | 116 | |
| Result | Wins | 26 | 26 | 711 | 190-351 | 54.1 | 33-62 | 53.2 | 156-197 | 79.2 | 569 |
| Losses | 3 | 3 | 97 | 28-55 | 50.9 | 3-9 | 33.3 | 20-23 | 87.0 | 79 | |
| Month | November | 6 | 6 | 141 | 48-73 | 65.8 | 4-6 | 66.7 | 29-41 | 70.7 | 129 |
| December | 4 | 4 | 126 | 28-60 | 46.7 | 2-7 | 28.6 | 27-35 | 77.1 | 85 | |
| January | 9 | 9 | 242 | 60-118 | 50.8 | 12-25 | 48.0 | 57-63 | 90.5 | 189 | |
| February | 7 | 7 | 217 | 55-106 | 51.9 | 14-22 | 63.6 | 43-58 | 74.1 | 167 | |
| March | 3 | 3 | 82 | 27-49 | 55.1 | 4-11 | 36.4 | 20-23 | 87.0 | 78 |
Splits Stats - Shooting per 40 min
| gp | gs | min/g | fg/40 | pct | 3pt/40 | pct | ft/40 | pct | pts/40 | ||
|---|---|---|---|---|---|---|---|---|---|---|---|
| Event | Total | 29 | 29 | 27.9 | 10.8-20.1 | 53.7 | 1.8-3.5 | 50.7 | 8.7-10.9 | 80.0 | 32.1 |
| Conference | 14 | 14 | 27.9 | 10.6-20.0 | 52.8 | 1.9-3.7 | 52.8 | 8.9-10.6 | 84.5 | 32.0 | |
| Exhibition | - | - | - | 0.0-0.0 | - | 0.0-0.0 | - | 0.0-0.0 | - | - | |
| Location | Home | 13 | 13 | 26.5 | 10.5-19.8 | 52.9 | 2.7-4.7 | 57.5 | 9.1-10.6 | 85.7 | 32.7 |
| Away | 11 | 11 | 29.4 | 11.0-19.8 | 55.6 | 1.4-3.1 | 44.0 | 7.7-9.8 | 78.5 | 31.1 | |
| Neutral | 5 | 5 | 28.2 | 11.1-21.6 | 51.3 | 0.6-1.7 | 33.3 | 10.2-14.2 | 72.0 | 32.9 | |
| Result | Wins | 26 | 26 | 27.3 | 10.7-19.7 | 54.1 | 1.9-3.5 | 53.2 | 8.8-11.1 | 79.2 | 32.0 |
| Losses | 3 | 3 | 32.3 | 11.5-22.7 | 50.9 | 1.2-3.7 | 33.3 | 8.2-9.5 | 87.0 | 32.6 | |
| Month | November | 6 | 6 | 23.5 | 13.6-20.7 | 65.8 | 1.1-1.7 | 66.7 | 8.2-11.6 | 70.7 | 36.6 |
| December | 4 | 4 | 31.5 | 8.9-19.0 | 46.7 | 0.6-2.2 | 28.6 | 8.6-11.1 | 77.1 | 27.0 | |
| January | 9 | 9 | 26.9 | 9.9-19.5 | 50.8 | 2.0-4.1 | 48.0 | 9.4-10.4 | 90.5 | 31.2 | |
| February | 7 | 7 | 31.0 | 10.1-19.5 | 51.9 | 2.6-4.1 | 63.6 | 7.9-10.7 | 74.1 | 30.8 | |
| March | 3 | 3 | 27.3 | 13.2-23.9 | 55.1 | 2.0-5.4 | 36.4 | 9.8-11.2 | 87.0 | 38.0 |
Splits Stats - Ball control per game
| gp | gs | mpg | off/g | def/g | reb/g | pf/g | dq/g | ast/g | to/g | a/to | stl/g | blk/g | ||
|---|---|---|---|---|---|---|---|---|---|---|---|---|---|---|
| Event | Total | 29 | 29 | 27.9 | 2.4 | 6.4 | 8.8 | 2.0 | 0.0 | 1.6 | 2.6 | 0.6 | 2.9 | 1.1 |
| Conference | 14 | 14 | 27.9 | 2.6 | 5.8 | 8.4 | 2.2 | 0.1 | 1.6 | 2.9 | 0.6 | 3.1 | 1.4 | |
| Exhibition | - | - | - | - | - | - | - | - | - | - | - | - | - | |
| Location | Home | 13 | 13 | 26.5 | 2.2 | 6.7 | 8.8 | 1.3 | 0.0 | 1.5 | 2.2 | 0.7 | 3.1 | 1.3 |
| Away | 11 | 11 | 29.4 | 2.0 | 5.7 | 7.7 | 2.8 | 0.1 | 1.7 | 3.5 | 0.5 | 2.7 | 1.1 | |
| Neutral | 5 | 5 | 28.2 | 3.8 | 7.4 | 11.2 | 1.8 | 0.0 | 1.6 | 1.8 | 0.9 | 2.6 | 0.6 | |
| Result | Wins | 26 | 26 | 27.3 | 2.4 | 6.1 | 8.5 | 2.0 | 0.0 | 1.8 | 2.4 | 0.7 | 2.9 | 1.0 |
| Losses | 3 | 3 | 32.3 | 2.0 | 9.7 | 11.7 | 1.7 | 0.0 | 0.3 | 4.3 | 0.1 | 2.3 | 2.0 | |
| Month | November | 6 | 6 | 23.5 | 2.2 | 4.5 | 6.7 | 1.8 | 0.0 | 1.8 | 1.5 | 1.2 | 2.3 | 0.3 |
| December | 4 | 4 | 31.5 | 3.3 | 9.3 | 12.5 | 1.5 | 0.0 | 1.3 | 4.0 | 0.3 | 3.8 | 1.0 | |
| January | 9 | 9 | 26.9 | 2.9 | 7.1 | 10.0 | 2.1 | 0.1 | 2.2 | 2.7 | 0.8 | 3.2 | 1.0 | |
| February | 7 | 7 | 31.0 | 1.7 | 5.0 | 6.7 | 2.0 | 0.0 | 1.1 | 2.6 | 0.4 | 3.1 | 1.9 | |
| March | 3 | 3 | 27.3 | 1.7 | 8.0 | 9.7 | 2.3 | 0.0 | 1.0 | 2.7 | 0.4 | 1.0 | 1.3 |
Splits Stats - Ball control totals
| gp | gs | min | off | def | reb | pf | dq | ast | to | a/to | stl | blk | ||
|---|---|---|---|---|---|---|---|---|---|---|---|---|---|---|
| Event | Total | 29 | 29 | 808 | 69 | 187 | 256 | 57 | 1 | 47 | 75 | 0.6 | 83 | 32 |
| Conference | 14 | 14 | 390 | 36 | 81 | 117 | 31 | 1 | 23 | 40 | 0.6 | 44 | 19 | |
| Exhibition | - | - | - | - | - | - | - | - | - | - | - | - | - | |
| Location | Home | 13 | 13 | 344 | 28 | 87 | 115 | 17 | 0 | 20 | 28 | 0.7 | 40 | 17 |
| Away | 11 | 11 | 323 | 22 | 63 | 85 | 31 | 1 | 19 | 38 | 0.5 | 30 | 12 | |
| Neutral | 5 | 5 | 141 | 19 | 37 | 56 | 9 | 0 | 8 | 9 | 0.9 | 13 | 3 | |
| Result | Wins | 26 | 26 | 711 | 63 | 158 | 221 | 52 | 1 | 46 | 62 | 0.7 | 76 | 26 |
| Losses | 3 | 3 | 97 | 6 | 29 | 35 | 5 | 0 | 1 | 13 | 0.1 | 7 | 6 | |
| Month | November | 6 | 6 | 141 | 13 | 27 | 40 | 11 | 0 | 11 | 9 | 1.2 | 14 | 2 |
| December | 4 | 4 | 126 | 13 | 37 | 50 | 6 | 0 | 5 | 16 | 0.3 | 15 | 4 | |
| January | 9 | 9 | 242 | 26 | 64 | 90 | 19 | 1 | 20 | 24 | 0.8 | 29 | 9 | |
| February | 7 | 7 | 217 | 12 | 35 | 47 | 14 | 0 | 8 | 18 | 0.4 | 22 | 13 | |
| March | 3 | 3 | 82 | 5 | 24 | 29 | 7 | 0 | 3 | 8 | 0.4 | 3 | 4 |
Splits Stats - Ball control per 40 min
| gp | gs | mpg | off/40 | def/40 | reb/40 | pf/40 | dq/40 | ast/40 | to/40 | a/to | stl/40 | blk/40 | ||
|---|---|---|---|---|---|---|---|---|---|---|---|---|---|---|
| Event | Total | 29 | 29 | 27.9 | 3.4 | 9.3 | 12.7 | 2.8 | 0.0 | 2.3 | 3.7 | 0.6 | 4.1 | 1.6 |
| Conference | 14 | 14 | 27.9 | 3.7 | 8.3 | 12.0 | 3.2 | 0.1 | 2.4 | 4.1 | 0.6 | 4.5 | 1.9 | |
| Exhibition | - | - | - | - | - | - | - | - | - | - | - | - | - | |
| Location | Home | 13 | 13 | 26.5 | 3.3 | 10.1 | 13.4 | 2.0 | 0.0 | 2.3 | 3.3 | 0.7 | 4.7 | 2.0 |
| Away | 11 | 11 | 29.4 | 2.7 | 7.8 | 10.5 | 3.8 | 0.1 | 2.4 | 4.7 | 0.5 | 3.7 | 1.5 | |
| Neutral | 5 | 5 | 28.2 | 5.4 | 10.5 | 15.9 | 2.6 | 0.0 | 2.3 | 2.6 | 0.9 | 3.7 | 0.9 | |
| Result | Wins | 26 | 26 | 27.3 | 3.5 | 8.9 | 12.4 | 2.9 | 0.1 | 2.6 | 3.5 | 0.7 | 4.3 | 1.5 |
| Losses | 3 | 3 | 32.3 | 2.5 | 12.0 | 14.4 | 2.1 | 0.0 | 0.4 | 5.4 | 0.1 | 2.9 | 2.5 | |
| Month | November | 6 | 6 | 23.5 | 3.7 | 7.7 | 11.3 | 3.1 | 0.0 | 3.1 | 2.6 | 1.2 | 4.0 | 0.6 |
| December | 4 | 4 | 31.5 | 4.1 | 11.7 | 15.9 | 1.9 | 0.0 | 1.6 | 5.1 | 0.3 | 4.8 | 1.3 | |
| January | 9 | 9 | 26.9 | 4.3 | 10.6 | 14.9 | 3.1 | 0.2 | 3.3 | 4.0 | 0.8 | 4.8 | 1.5 | |
| February | 7 | 7 | 31.0 | 2.2 | 6.5 | 8.7 | 2.6 | 0.0 | 1.5 | 3.3 | 0.4 | 4.1 | 2.4 | |
| March | 3 | 3 | 27.3 | 2.4 | 11.7 | 14.1 | 3.4 | 0.0 | 1.5 | 3.9 | 0.4 | 1.5 | 2.0 |